PRIVATE EQUITY
Aura Funds Completes Exit of 1300 Australia
Aura Funds led the management buyout of 1300 Australia from Telstra in November 2017
Since the burst of the dotcom bubble in Mar’20, the NASDAQ Composite Index reached an all time high of 14,095.47 points on 17 February 2021

Since the burst of the dotcom bubble in Mar’20, the NASDAQ Composite Index reached an all-time high of 14,095.47 points on 17 February 20211 compared to where the index bottomed at 1,139.90 on 4 October 2002.
Today you have the world’s top 3 richest people made up of tech founders after Elon Musk overtook finance rock star Warren Buffett in mid-20202. “Frothy”, “toppy” and “bubble-like” are all common words used to describe current market conditions giving a sense of déjà vu when comparing the current valuation run-up to the tech bubble of the mid to late 1990s. So, what are we to make of this? Are we really in another tech bubble waiting to pop?
To assess this question, we looked for key differences between the current boom compared with the dot-com period:
Close to 0% Interest Rates – During the time when stocks peaked in the 1999/2000 period, the US Federal Reserve simultaneously raised its interest rates to a new cycle-high. This created an alternative investment opportunity to booming tech stocks by creating attractive returns from bonds. With current interest rates being near 0%, there is no similar alternative for investors today and therefore fuelling liquidity in the equity market.
Lessons learnt by internet giants – the largest companies such as Facebook, Amazon and Alphabet are capturing a majority of incremental market growth. The network effect created by these companies have allowed them to grow faster as they increased their user base. They appear to have learned from the mistakes that the big companies made in the dotcom era by obsessing over the need to ensure their technologies and business models stay relevant creating defensible moats around their business.
Profits on tech stocks are now more in sync with prices – During the height of the dotcom boom, share prices of internet companies outran their earnings potential, extending valuations to unsustainable levels. As you can see from the graph below, profits for technology companies today are materially more in sync with their share price than in the last boom.
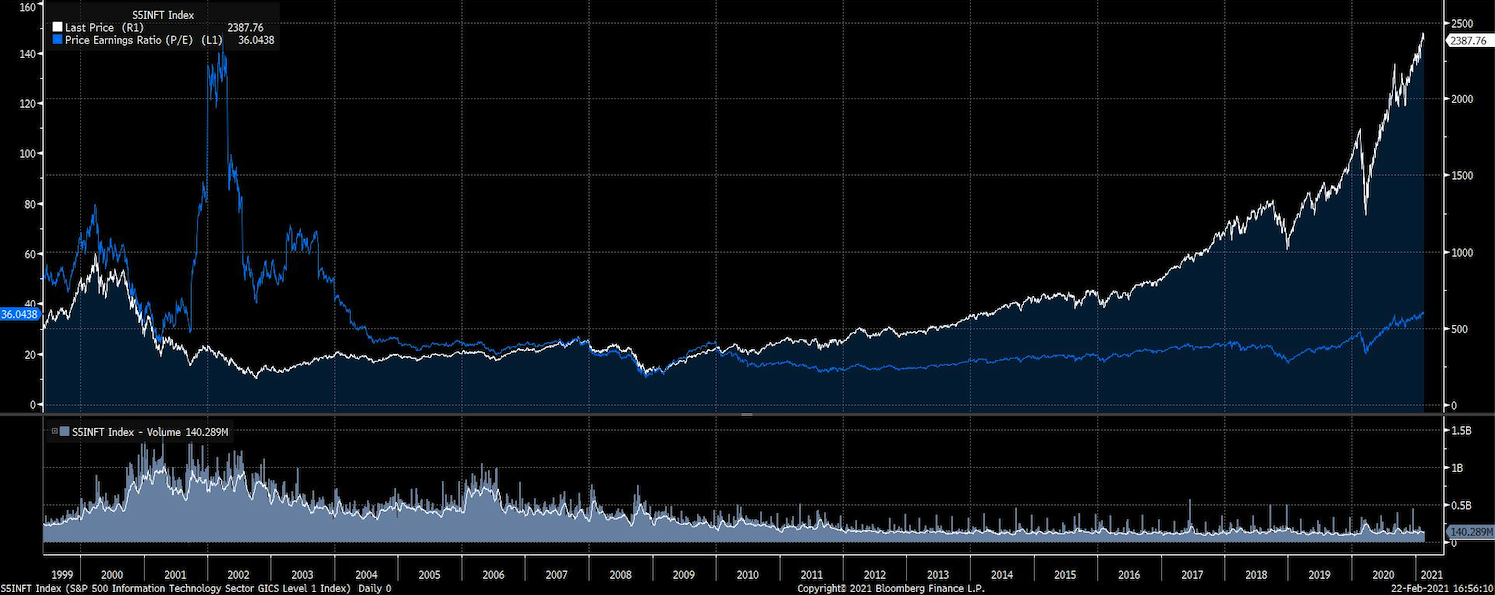
Source: Bloomberg. S&P 500 Information Technology Sector. As at Feb 2021.
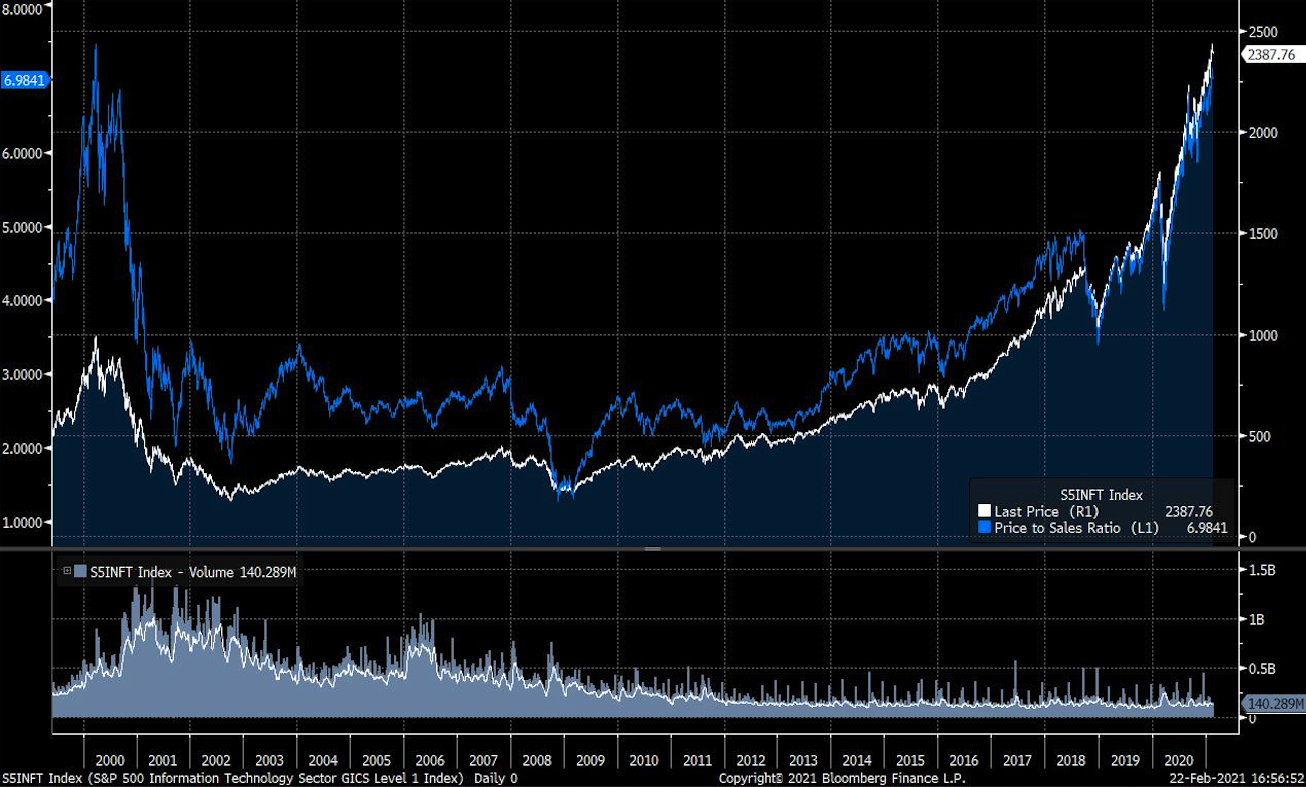
Source: Bloomberg. S&P 500 Information Technology Sector. As at Feb 2021.
4. Price-to-Book (P/B) and Price-to-Sales (P/S) ratios are climbing to dotcom levels – while Price-to-Earnings Ratios are materially lower than the 1999/2000 period, we note that a lot of the companies in the year 2000 had negative earnings. To provide an alternative valuation perspective we looked to the P/B and P/S ratios for the same period. We can see that P/S ratio has climbed to similar levels while the P/B ratio are a few steps behind. From this basis, valuation gaps between the two periods appear to be closer than their earnings may indicate.
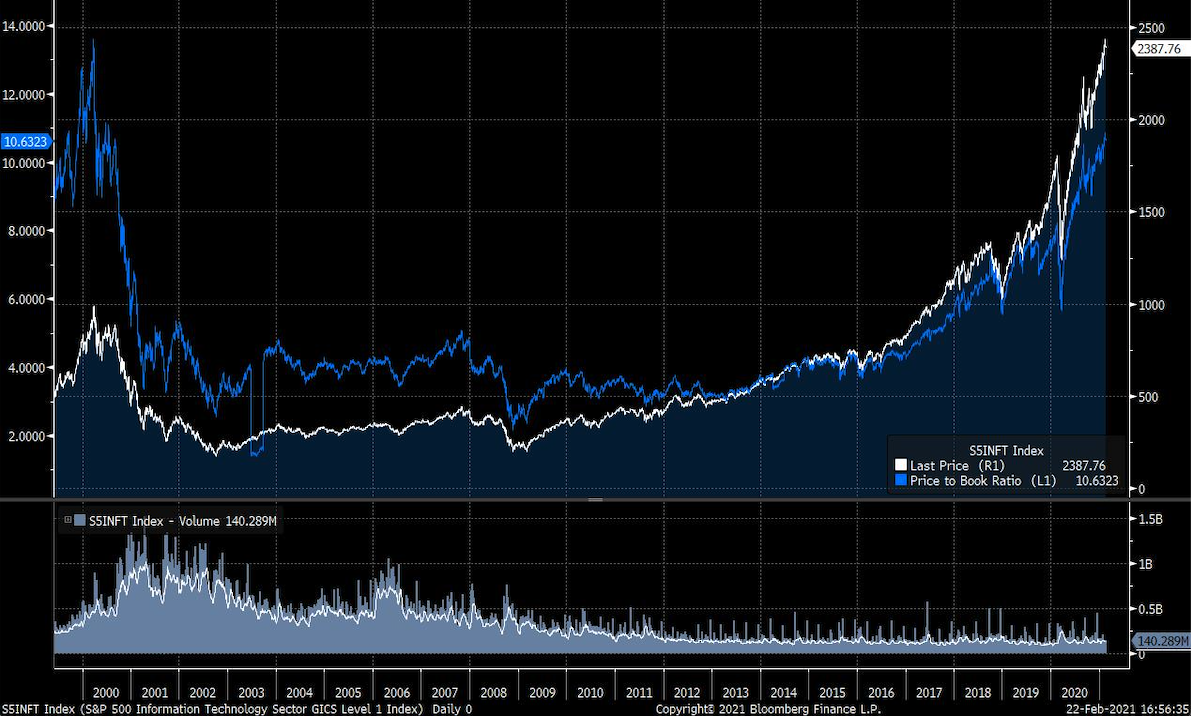
Source: Bloomberg. S&P 500 Information Technology Sector. As at Feb 2021.
We won’t attempt to predict the future of this tech boom saga as our crystal ball is as opaque as others. However, it is evident that this doppelganger of the dotcom era has many different characteristics which makes one question whether history will repeat itself (or when).
Sources:
1. Yahoo Finance
2. Bloomberg Billionaires Index (as at 17 February 2021)
Important information
This information is for wholesale or sophisticated investors only and is provided by Aura Group and related entities and is only for information and general news purposes. It does not constitute an offer or invitation of any sort in any jurisdiction. Moreover, the information in this document will not affect Aura Group’s investment strategy for any funds in any way. The information and opinions in this document have been derived from or reached from sources believed in good faith to be reliable but have not been independently verified. Aura Group makes no guarantee, representation or warranty, express or implied, and accepts no responsibility or liability for the accuracy or completeness of this information. No reliance should be placed on any assumptions, forecasts, projections, estimates or prospects contained within this document. You should not construe any such information or any material, as legal, tax, investment, financial, or other advice. This information is intended for distribution only in those jurisdictions and to those persons where and to whom it may be lawfully distributed. All information is of a general nature and does not address the personal circumstances of any particular individual or entity. The views and opinions expressed in this material are those of the author as of the date indicated and any such views are subject to change at any time based upon market or other conditions. The information may contain certain statements deemed to be forward-looking statements, including statements that address results or developments that Aura expects or anticipates may occur in the future. Any such statements are not guarantees of any future performance and actual results or developments may differ materially from those projected in the forward-looking statements. This information is for the use of only those persons to whom it is given. If you are not the intended recipient, you must not disclose, redistribute or use the information in any way.
Aura Group subsidiaries issuing this information include Aura Group (Singapore) Pte Ltd (Registration No. 201537140R) which is regulated by the Monetary Authority of Singapore as a holder of a Capital Markets Services Licence, and Aura Capital Pty Ltd (ACN 143 700 887) Australian Financial Services Licence 366230 holder in Australia and is issued to accredited, qualified, wholesale, sophisticated and institutional investors only.
Aura Funds led the management buyout of 1300 Australia from Telstra in November 2017
The 19 April 2024 halving has decreased the reward to 3.125 Bitcoins. Each halving event has historically been followed by significant bullish trends...
Despite 2020 being an unprecedented year for many businesses, the private equity industry in Southeast Asia actually grew by 4% in the first half of...