If you could focus on only one metric to guide your life, what would it be? Salary, retweets, distance walked, # productive hours, happiness score…
There are an infinite number of ways to measure and monitor your life but with this smorgasbord of stats, it is easy to lose sight of what really matters. What if one metric was so powerful that it affected all others?
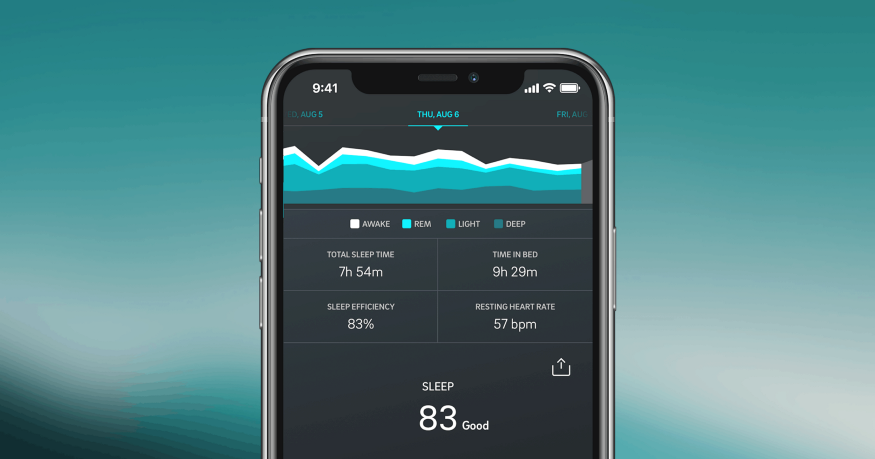
Personally, the only metric I need to monitor in my life is my sleep score. It is the best predictor of my energy levels, mood, happiness, motivation and even intellectual and physical performance.
By focusing on one metric, my life is simpler. But more importantly, I can easily identify the levers to change this score — consistent wake-up time, reduced blue light exposure at night, less caffeine, less stress and more exercise. All these levers affect my sleep quality.
By relentlessly focusing on this one metric, everything else falls into place — productive hours, motivation and happiness.
That is a north star metric.
For a business, a north star metric is the one thing that the company should place above all else as it has the greatest effect on the entire system. By finding this metric, a business can easily identify the levers that accelerate it.
All north star metrics are about how to increase revenue, some are just more abstracted than others. One business might actually have annualised reoccurring revenue as their north star while another might have the number of messages sent on their platform.
Lenny has a great question to ask to find your business’ north star:
Which metric, if it were to increase today, would most accelerate my business’ flywheel?
Facebook’s North Star
The canonical example of a north star metric is from Facebook’s early days. Facebook realised that the only thing it needed to focus on was getting each new user to add seven friends in the first two weeks. Users that didn’t would stop using the platform almost straight away. By focusing on this one metric, it benefited all other parts of the system — retention, growth, usage and eventually revenue.
The opposite of a north star metric is a vanity metric; a metric that is disconnected from the business’s core function but included to make the business look better. These are to be avoided at all costs and include things like page views, social media followers and running total of customers…
Vanity metrics are like blindly following a broken compass for both entrepreneurs and investors.
Finding the right north star metric allows a business to go in the right direction over long periods of time.
Different types of businesses have different north stars. After looking at forty of the most popular north star metrics for high growth companies — I believe there are some patterns.
I make too many flow charts
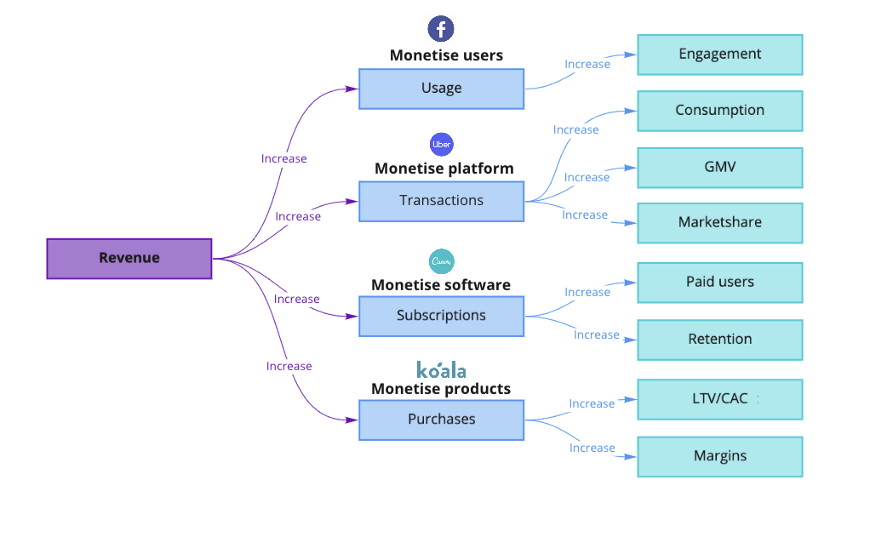
Broadly speaking, there are four types of businesses:
Monetise users: Businesses that make money by selling their users as eyeballs for ads or data points for third parties. E.g. Facebook, Twitter, Robinhood
Monetise platform: Businesses that make money by charging transaction fees on marketplaces or other types of platform products. E.g. Uber, Amazon or Stripe
Monetise software: Businesses that make money by renting software. E.g. Canva, Miro or Airtable.
Monetise product: Businesses that make money by selling a product once, generally a physical product. E.g. Koala, Casper or Bose.
The category of business often determines the north star metric.
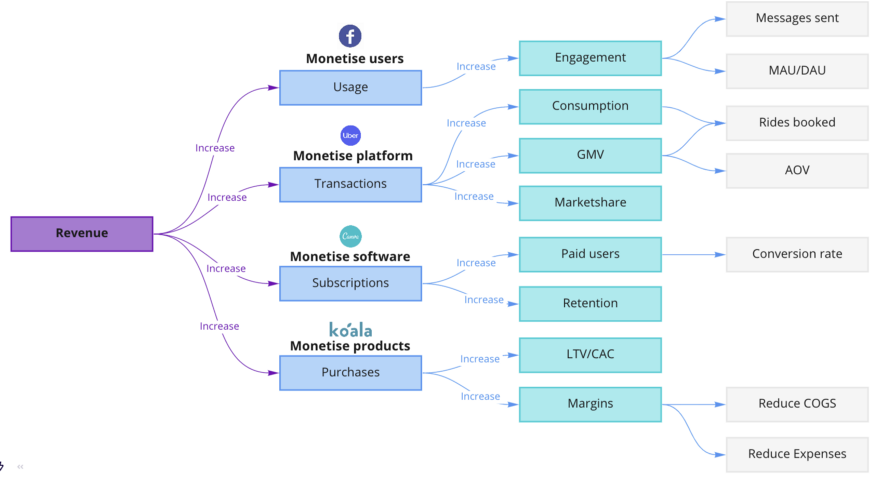
For example, platform businesses make money off transactions, so they should optimise for increasing the gross merchandise value of the platform. This can be done by increasing the core action that precedes the transaction (‘consumption’). For Uber this would be to increase the number of rides booked. Importantly, because these transacting fees are usually low, platform businesses need significant market share to be profitable. This is why market share is another common north star metric for platform businesses.
An important part of monitoring these metrics is understanding the levers that impact them the most. Each of these levers have more levers, which in turn have more levers.
The art and science is to pick the ones that matter most. It’s all about the Pareto principle.
What 20% of levers amount for 80% of the variance in our north star metric?
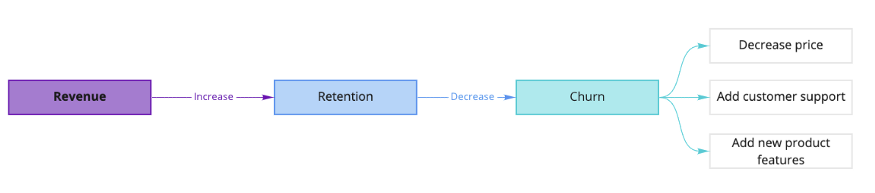
Let’s say your focus is on improving retention because each year 15% of your customers churn. The levers could be price, the level of customer support and the number of product features.
But without understanding the most important levers, you could spend on new product features or dropping prices when in reality customers just wanted customer support.
Pick a north star metric, identify the levers that matter and optimise relentlessly.
How do you present metrics to VCs?
Don't emphasise irrelevant metrics: Make sure the metrics you present are relevant to what matters for your business. A platform business should be careful about stressing monthly average user (MAU) website growth. Investors will either assume your transaction volumes are low, or you don’t have a grasp of what is important for that type of business. Show the relevant metrics, even if they are lacklustre. If they are, try and explain the precise levers that drive them and why you think the future will be different. Not only is it a sign of integrity but it is also a sign of deep domain knowledge — both of which are better than an irrelevant hockey stick graph.
Provide every bit of detail for relevant metrics: Before an investor can back your company, there is a long and winding road called due diligence. They will interrogate every figure on every spreadsheet imaginable. There is no point in omitting important details to make metrics look better. Investors are generally more impressed by metrics provided with granularity as opposed to vague and nondescript numbers. Afterwork VC made a great post on what to include. TLDR; Include timeframe, type of revenue and key inflection points.
Marry the tailwinds to the data: If there is anything VCs love more than hockey stick graphs, it’s tailwinds. These are trends that are giving wind to the sails of your product or market. If you can explain your metrics in the context of tailwinds — it is very compelling for investors. An example would be if your app had rapidly increasing user engagement from teenagers and you can provide data the shows structural shift of young people from using laptops to iPhones.
Thank you for putting up with me for this long, I have included some resources if you want to read further on the topic.
This information is for accredited, qualified, institutional, wholesale or sophisticated investors only and is provided by Aura Group and related entities and is only for information and general news purposes. It does not constitute an offer or invitation of any sort in any jurisdiction. Moreover, the information in this document will not affect Aura Group’s investment strategy for any funds in any way. The information and opinions in this document have been derived from or reached from sources believed in good faith to be reliable but have not been independently verified. Aura Group makes no guarantee, representation or warranty, express or implied, and accepts no responsibility or liability for the accuracy or completeness of this information. No reliance should be placed on any assumptions, forecasts, projections, estimates or prospects contained within this document. You should not construe any such information or any material, as legal, tax, investment, financial, or other advice. This information is intended for distribution only in those jurisdictions and to those persons where and to whom it may be lawfully distributed. All information is of a general nature and does not address the personal circumstances of any particular individual or entity. The views and opinions expressed in this material are those of the author as of the date indicated and any such views are subject to change at any time based upon market or other conditions. The information may contain certain statements deemed to be forward-looking statements, including statements that address results or developments that Aura expects or anticipates may occur in the future. Any such statements are not guarantees of any future performance and actual results or developments may differ materially from those projected in the forward-looking statements. This information is for the use of only those persons to whom it is given. If you are not the intended recipient, you must not disclose, redistribute or use the information in any way.
Aura Group subsidiaries issuing this information include Aura Group (Singapore) Pte Ltd (Registration No. 201537140R) which is regulated by the Monetary Authority of Singapore as a holder of a Capital Markets Services Licence, and Aura Capital Pty Ltd (ACN 143 700 887) Australian Financial Services Licence 366230 holder in Australia.