It has been a big month with bank runs leading to bank collapses, the bailout of Credit Suisse and fresh short-seller attacks on Deutsche Bank.
All the while, we are operating against the backdrop of continued interest rate hikes to contain raging global inflation, trade wars and real wars and billions lost and still missing in the crypto universe. As an investor, it's often hard to cut out the noise to make informed decisions about capital allocation.
To keep things simple many investors focus on indicators like the Shiller PE and the Buffett Indicator. In this article, we'll explain what these indicators are, how they work, and how you can use them to make investment decisions.
Overview of Shiller PE
The Shiller PE (also known as the CAPE ratio) was developed by Nobel Prize-winning economist Robert Shiller. It's a measure of a stock or market’s price relative to its average earnings over the past ten years, adjusted for inflation (this is particularly important in the current elevated inflation environment). This metric is often used to gauge whether a market is overvalued or undervalued.
The resulting ratio is then compared to historical averages to determine whether a stock or the overall market is overvalued or undervalued.
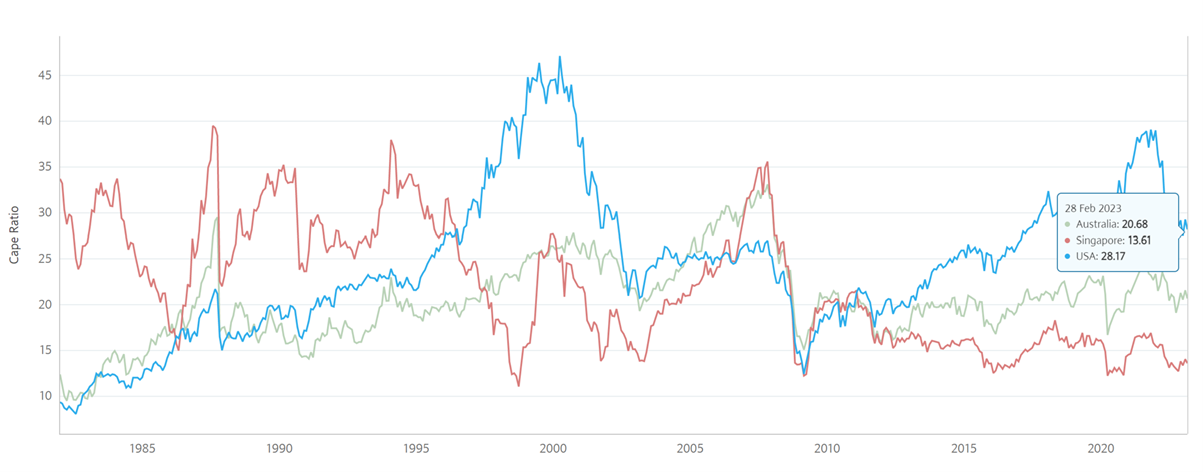
As you can see from the above chart, the Shiller PE ratio for S&P500 remains elevated relative to historical averages (mean 17.01, median 15.91) whilst the Australian market is trading close to and Singapore market below historical averages.
The advantage of using the Shiller PE ratio is that it takes into account the business cycle's fluctuations and avoids the noise associated with short-term earnings volatility. The downside is that it can sometimes be slow to reflect changes in the economy or a company's earnings.
About the Buffett Indicator
As pointed out by Warren Buffett, the percentage of total market cap (TMC) relative to the US GDP is “probably the best single measure of where valuations stand at any given moment.”
The Buffett Indicator is calculated by dividing the total market capitalization of all publicly traded companies by the country's GDP. The resulting ratio is then compared to historical averages to determine whether the market is overvalued or undervalued.
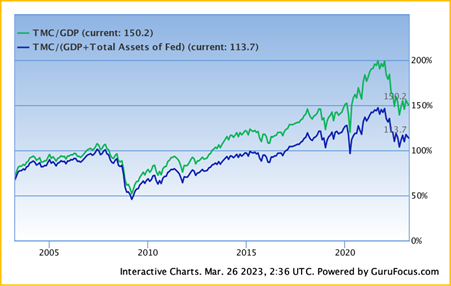
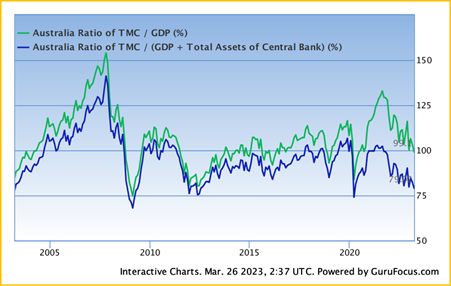
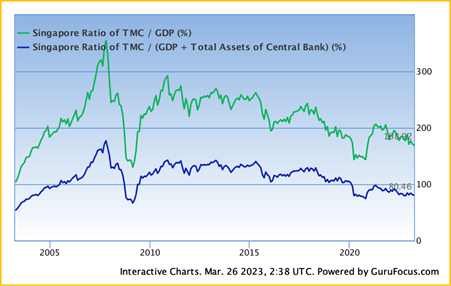
As you can see from the above charts the Buffet Indicator indicates that the US stock market remains elevated relative to historical averages whilst the Australian share market is trading close to and Singapore share market below historical averages.
A downside of both indicators is that it doesn't take into account the different sectors' valuations or the fact that some companies might be overvalued while others are undervalued.
What are the inputs?
Over the long term, the returns from equity markets are mainly determined by three major factors: interest rates, corporate profits, and market valuations and expectations.
Interest rates
Interest rates “act on financial valuations the way gravity acts on matter: The higher the rate, the greater the downward pull. That's because the rates of return that investors need from any kind of investment are directly tied to the risk-free rate that they can earn from government securities. So if the government rate rises, the prices of all other investments must adjust downward, to a level that brings their expected rates of return into line. Conversely, if government interest rates fall, the move pushes the prices of all other investments upward.”—Warren Buffett.
Higher interest rates can drive demand towards fixed income and away from equity markets. Currently, central banks around the world are continuing to increase interest rates to fight inflation, when there is visibility of this ending or reversing it may be bullish for valuations.
Corporate Profits
Currently interest rates are working to slow consumer demand which will in turn impact corporate profits. Corporates are reacting by becoming leaner and more cost efficient. Those that cannot adapt to tighter conditions will need to restructure or fail. During recessions, corporate profit margins shrink, and during economic growth periods, corporate profit margins expand. However, long-term growth of corporate profitability is close to long-term economic growth.
Market Valuations & Expectations
Over the long run, equity market valuations tend to revert to the mean. Assuming this remains true, higher current valuations should correlate with lower long-term returns in the future. On the other hand, a lower current valuation level correlates with a higher long-term return. In the short term, expectations including greed and fear can drive over valuation or undervaluation.
Similarly, as we covered in this recent article, private equity vintages that deployed capital in cheaper valuation environments as proxied by the S&P500 tended to outperform vintages that deployed capital in richer valuation environments. At the extremes, the worst-performing vintage of those that invested in an average 15 or below P/E ratio environment still outperformed the best-performing vintage of those that invested in an environment with an average 25 or above P/E ratio. This pattern persists when analysing recessionary versus non-recessionary periods.
Where to from here?
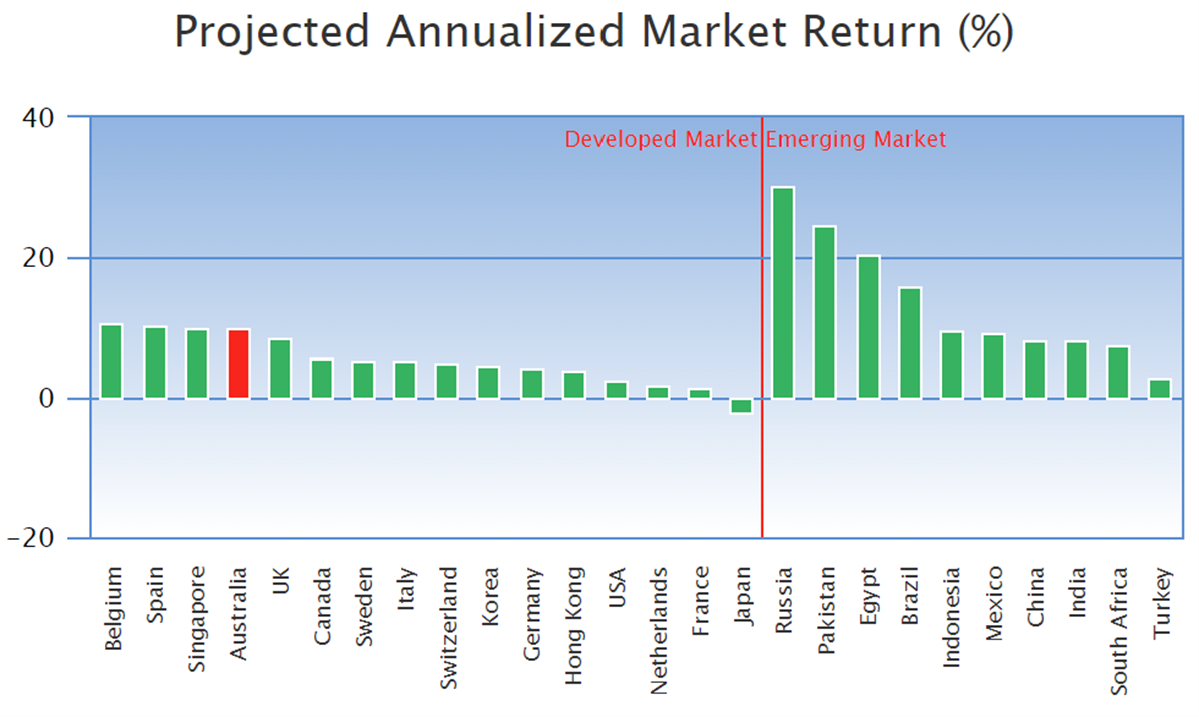
Based on this, the Buffett Indicator projected annualised market returns of various markets are outlined in the below chart.
It’s interesting to note that based on the Buffet Indicator, developed markets like Australia and Singapore are offering attractive projected annualised market returns, returns similar or better than many parts of the emerging world including China and India. So whilst there are likely more dominoes to fall in terms of the recent sagas, it’s important to look past the doom and gloom to position portfolios for the long term.
Until next month,
Calvin Ng
Managing Director
This information is for accredited, qualified, institutional, wholesale or sophisticated investors only and is provided by Aura Funds Management Pty Ltd (ABN 96 607 158 814, Authorised Representative No. 1233893 of Aura Capital Pty Ltd AFSL No. 366 230, ABN 48 143 700 887). Aura Funds Management Pty Ltd is the Trustee of all the Funds mentioned and a subsidiary of Aura Group Pty Ltd.
Any financial product advice given in this report is of a general nature only. The information has been provided without taking into account the investment objectives, financial situation or needs of any particular investor. Therefore, before acting on the information contained in this report you should seek professional advice and consider whether the information is appropriate in light of your objectives, financial situation and needs. Aura does not guarantee the performance of its funds, the repayment of any capital or any rate of return. Investing in any financial product is subject to investment risk including possible loss. Past performance is not a reliable indicator of future performance. Information in this report is based on the information provided to Aura by third parties that may not have been verified. Aura believes that the information is reliable but does not guarantee its accuracy or completeness. Aura is not able to give tax advice and accordingly, investors should obtain independent advice from an accountant and/or lawyer before making any decision based on the tax treatment of its investors. You must read the Fund Fact Sheet or Information Memorandum and seek professional advice before making a decision to invest in any of the funds.