During a recent “Understanding Private Credit” session in Singapore, questions were asked about “What is private credit, its role and how does it fit into one’s portfolio?” Many also asked about the potential demise of the classic 60/40 model of asset allocation. Through the years it was time-honoured that having 60% equities and 40% bonds represented reasonable diversification. This structured approach, based on diversification, was aimed at maximising performance at constant risk and provided an efficient framework to preserve capital over the long term and was deemed strategic asset allocation.
As the era of low inflation, low interest rates and globalisation is now firmly in the rearview and global economies are now facing the impact of inflation, higher interest rates, uncertainties and geopolitical disruptions, the classic 60/40 allocation model has come under closer scrutiny.
In 2022, a classic 60/40 allocation would have returned approximately −18.8%, as the negative correlation between stocks and bonds showed signs of reversing, as stocks (−21.1%) and bonds (−15.7%) moved downward in lockstep.1 Although through September 30, 2023, the traditional portfolio allocation did fare better, returning approximately 5.8%, however, the correlation between stocks and bonds only marched higher, reaching 0.86 on a 12-month rolling basis through December 31, 2023.2 More importantly, over that same period, the fixed income component of a 60/40 portfolio contributed approximately 15% of portfolio volatility, versus just 5% historically.3
According to historical data, a portfolio with a 20% allocation to alternatives would have improved overall returns and reduced negative drawdowns during market stress compared to a traditional 60/40 portfolio. A simulation of outcomes, based on historical performance data, does suggest that downside risk reduction and higher returns can benefit by having an allocation to alternatives.
Hindsight is 20:20. And hindsight does show (in Exhibit 1 below) that a small allocation of alternative asset classes and strategies would have notably improved portfolio performance over the last ~16 years, with an assumption of an allocation of 20% to alternatives by reallocating proportionately from equity and fixed income.4
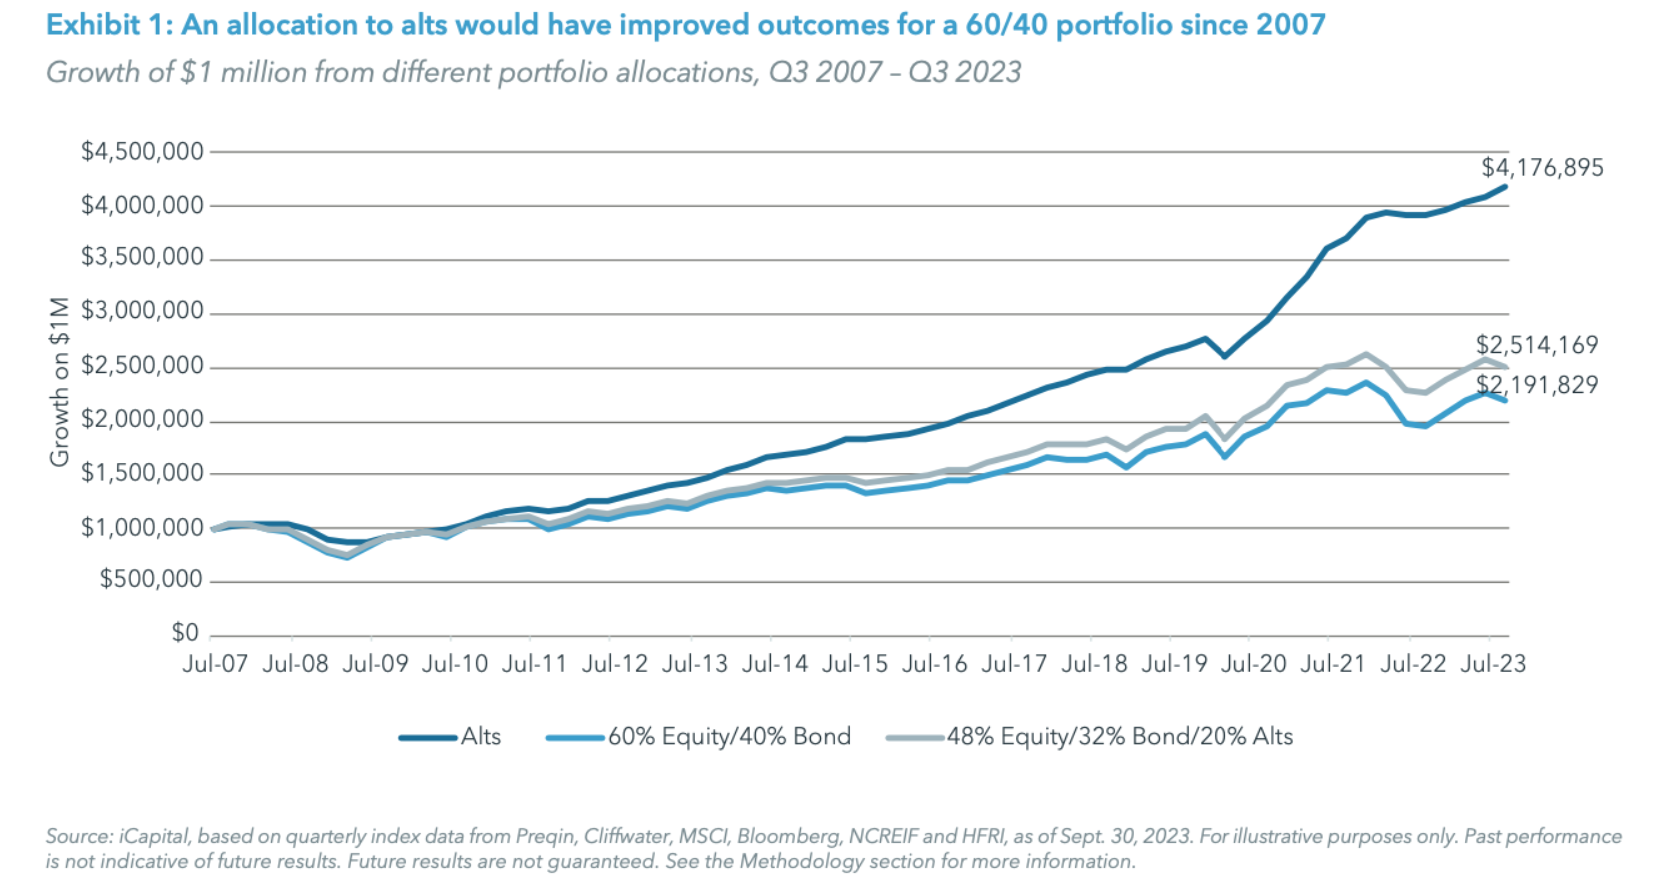
Just as important, the addition of alternatives does simultaneously reduced volatility. While volatility and risk are not necessarily the same thing, the former measures the magnitude of movements in both directions over time. Lower volatility often contributes to a reduction in measures of risk, such as drawdowns or maximum loss. Alternatives do have few attributes that does allow them to reduce volatility.
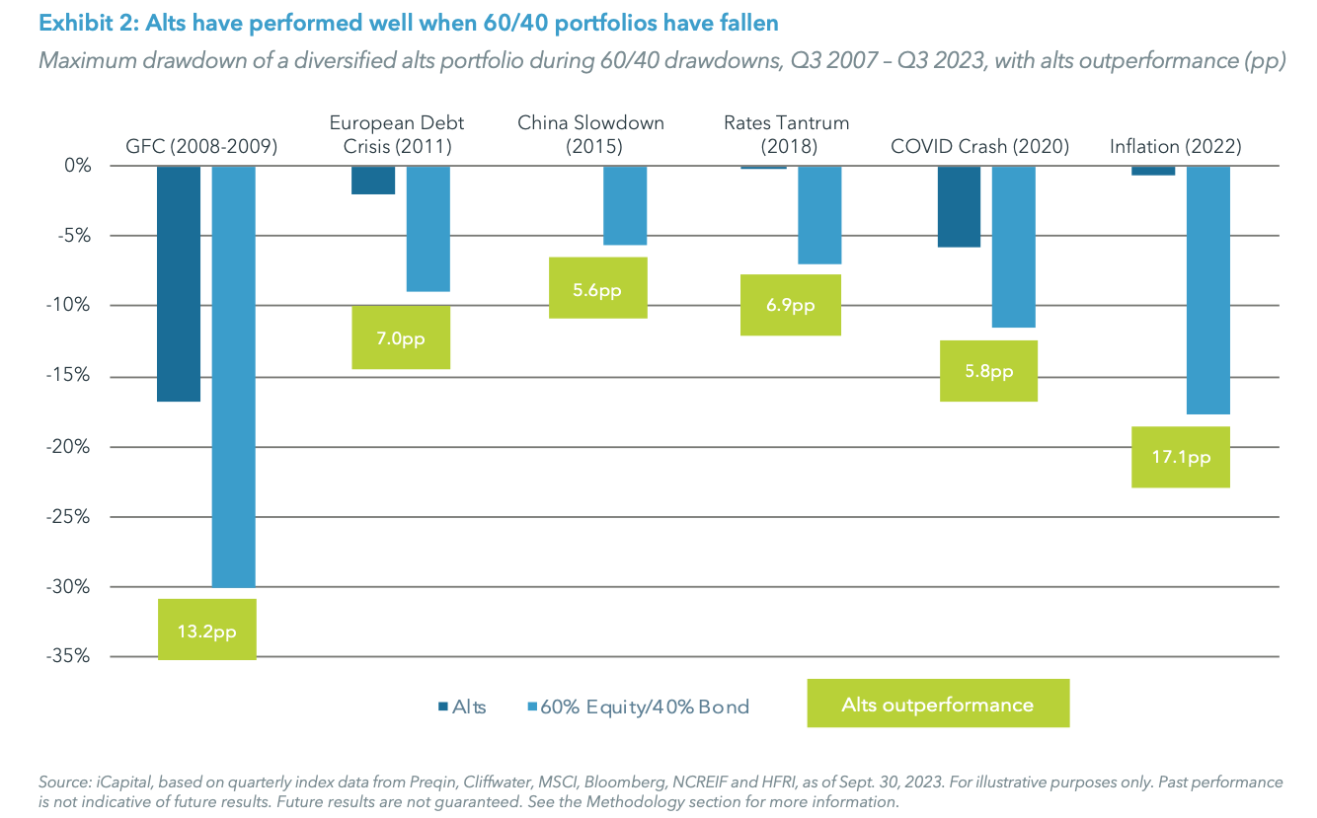
Alternatives’ ability to provide downside protection on average, captured only 22% of declines of traditional 60/40 portfolios over the drawdown periods since 2008 as shown in Exhibit 2 above.
Incorporating alternatives would have thus reduced portfolio losses by approximately 17%, on average, during periods of public market decline, an almost one-for-one reduction for each percentage allocation to alternatives, demonstrating the protection alternatives can offer in more challenging environments.
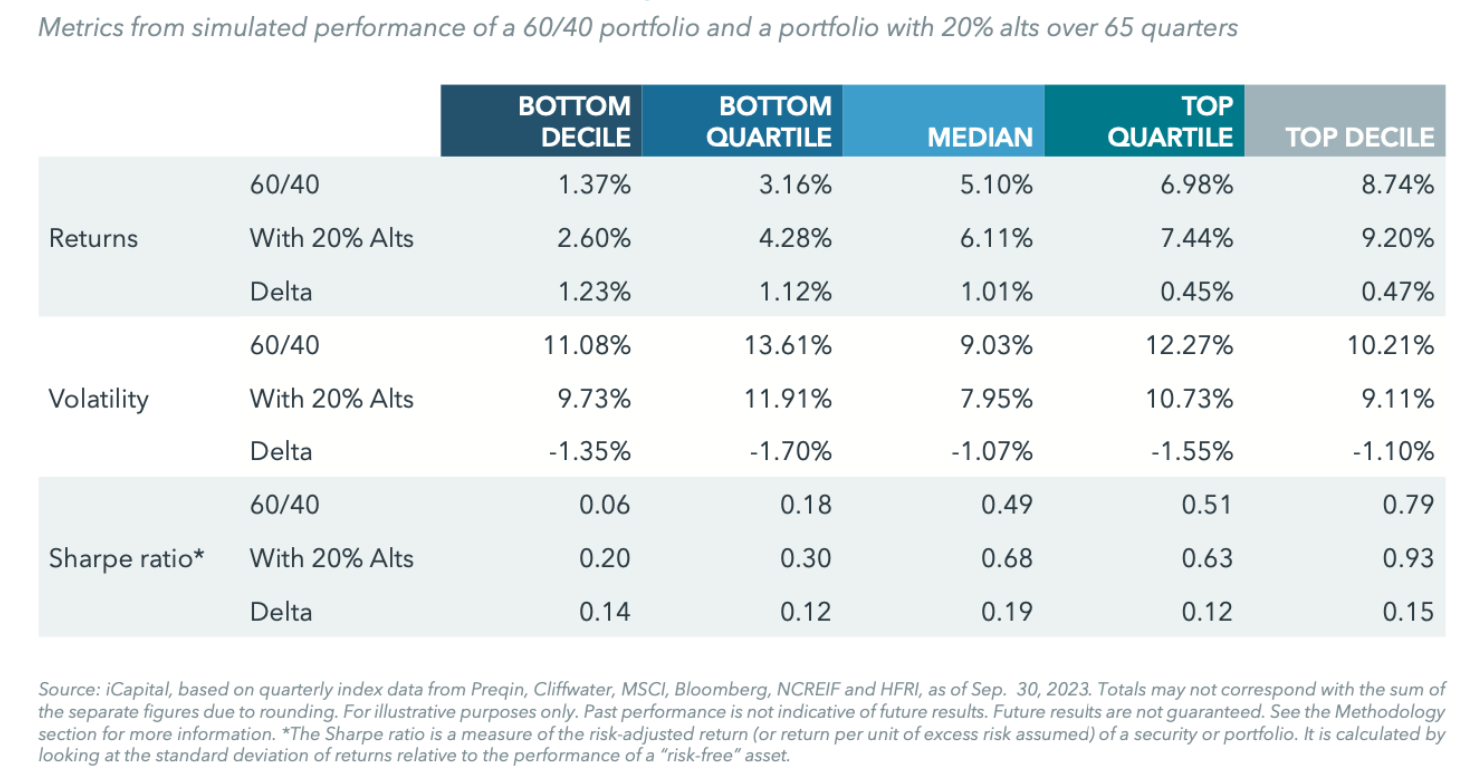
Exhibit 3 demonstrates what this might translate to in terms of annualised returns, volatility, and overall portfolio risk-return. In simple terms, the 50/30/20 alternative portfolio created improvements or “deltas” on each of these metrics across the simulated performance levels.
Strategic asset allocation relies on efficient diversification predicated on three key parameters: specific risk-return profile, sensitivity to economic factors (growth and inflation), and correlations among asset classes and combining them in the most efficient way. Investors will need to fully understand the Alternatives they choose to include, as both risks and liquidity profiles (redemption or lock up periods) are not necessarily the same as public markets.
Alternatives are no longer exclusive or niche. Private market assets under management are currently valued at over $13 trillion.5 With more investors seeking uncorrelated sources of return to help mitigate risk in a traditional 60/40 portfolio, these investments will likely become ever-present constituents of a well- balanced portfolio.
Footnotes:
- eVestment, based on monthly returns, as of Dec. 31, 2023
- eVestment, based on monthly returns, as of Dec. 31, 2023
- eVestment, based on monthly returns, as of Dec. 31, 2023. Historically refers to the period between Jan. 2000 – Dec. 2023.
- This results in an allocation of 48% to stocks, 32% to bonds, and 20% to alts. The 20% allocation to alts is purely illustrative. Optimal individual allocations will vary based upon resources, specific goals, risk tolerance, liquidity needs, and other factors.
-
Preqin, Future of Alternatives 2028, as of Oct. 27, 2023.