As I looked over the conditions for private equity this coming year, I stumbled upon a recent article from CAIS. In the report, it details how entry points at the deployment stage are correlated to the performance of mature private equity vintages, from 1988 to 2013.
I also reviewed similar data for venture capital fund performance and noticed that a similar correlation was not evident. My belief is that venture fund vintage performance is more correlated to technology adoption life cycles than market cycles.
The current environment affords private equity managers the opportunity to deploy capital at cheaper valuations and may be an attractive time to consider allocating to private equity funds.
An Overview of Private Equity Investing
In a typical private equity fund with capital call structures, funds are raised in a collective vehicle and drawn down in tranches. Funds are typically deployed within the first 1-5 years, i.e. the “investment period.” Over the course of the fund’s life, typically around 10 years, the manager will seek to improve the value of their portfolio companies and then to exit those portfolio companies to return cash to investors.
The gross return of a private equity fund is the difference between the price at which the portfolio companies are acquired in years 1-5 and sold in years 5-10. A private equity manager’s ability to select companies, negotiate terms, finance structures, improve company value and optimise portfolio company exits play a large part in the performance of a given fund.
An ideal deployment environment would typically be one in which companies can be acquired at a relatively lower valuation. An ideal exit environment would be one in which the price sold is relatively higher.
Given that market cycles tend to occur every 10 years or so (2001, 2007-09, 2020, 2022), a manager’s ability to raise and deploy funds during an economic downturn and the ability to exit when economic conditions are strong can add alpha to returns.
Correlation of Entry Point to Private Equity Vintage Performance
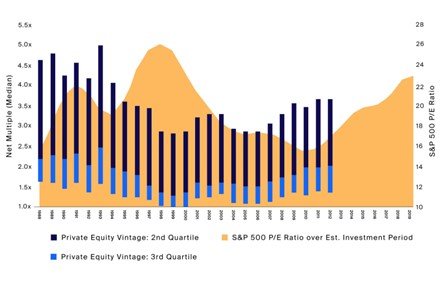
Source: Bloomberg, S&P 500 Average P/E over Est. Investment Period represented by the average of the Price to Earnings Ratio of the SPX Index over years 0-3 of the vintage year, Preqin, Private Equity Vintage: 2nd and 3rd Quartiles determined by the Preqin Private Equity-All vintage year benchmark Top Quartile Boundary (Q1), Median and the Bottom Quartile Boundary (Q3) Net Multiples as of 7/31/2022.
The chart below compares the performance, measured in net multiples of paid-in capital, of “mature” vintages (10+ years from the first investment). This performance is layered over the average Price to Earnings ratio (P/E) of the S&P 500 index over the investment period of funds in that given vintage. Vintages that have yet to reach 10 years (2013 and beyond) have been excluded.
The chart shows a cheaper valuation environment during the capital deployment stage correlates to better ultimate vintage performance.
The relative underperformance of private equity funds with vintages from 1998-2000 is clear. These funds deployed capital into the peak of the dot-com bubble, compared to those with vintages from 2001-2003, which were able to invest in companies at lower valuations after the dot-com crash. The same story appears true for funds in vintages 2004-2006, which deployed capital before the GFC and tended to underperform funds that deployed capital post-GFC.
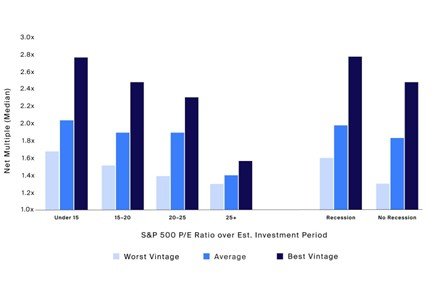
The chart below shows the same data arranged in a different way.
Source: S&P 500 Average P/E over Est. Investment Period represented by the average of the Price to Earnings Ratio of the SPX Index over years 0-3 of the vintage year, recession periods determined by USRINDEX Index, Preqin, Net Multiple (Median) by the Preqin Private Equity-All vintage year benchmark Median Net Multiple as of 7/31/2022.
Vintages are grouped by the richness of valuation environments during capital deployment, again measured by the average S&P 500 P/E ratio during their approximate investment periods.
Vintages that deployed capital in cheaper valuation environments tended to outperform vintages that deployed capital in richer valuation environments. At the extremes, the worst-performing vintage of those that invested in an average 15 or below P/E ratio environment still outperformed the best-performing vintage of those that invested in an environment with an average 25 or above P/E ratio.
This pattern persists when analysing recessionary vs. non-recessionary periods.
Why 2023 Could Be a Bumper Year for Private Equity
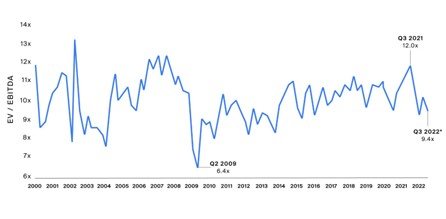
Private market multiples have fallen 20-30% from their recent peak, with the possibility of further falls. Anecdotally, Aura Private Equity has also seen similar falls in valuation expectations of target companies.
Source: Pitchbook, Implied EV/EBITDA Median of Completed Deals for All Buyout as of 8/12/2022.
Deploying capital in cheaper valuation environments tended to lead to higher-performing vintage than in richer investment environments.
Private equity fund investors should consider fund timing in relation to the market environment.
Therefore, the current environment affords private equity managers the opportunity to deploy capital at cheaper valuations and may be an attractive time to consider allocating to private equity funds.
This information is for accredited, qualified, institutional, wholesale or sophisticated investors only and is provided by Aura Group and related entities and is only for information and general news purposes. It does not constitute an offer or invitation of any sort in any jurisdiction. Moreover, the information in this document will not affect Aura Group’s investment strategy for any funds in any way. The information and opinions in this document have been derived from or reached from sources believed in good faith to be reliable but have not been independently verified. Aura Group makes no guarantee, representation or warranty, express or implied, and accepts no responsibility or liability for the accuracy or completeness of this information. No reliance should be placed on any assumptions, forecasts, projections, estimates or prospects contained within this document. You should not construe any such information or any material, as legal, tax, investment, financial, or other advice. This information is intended for distribution only in those jurisdictions and to those persons where and to whom it may be lawfully distributed. All information is of a general nature and does not address the personal circumstances of any particular individual or entity. The views and opinions expressed in this material are those of the author as of the date indicated and any such views are subject to change at any time based upon market or other conditions. The information may contain certain statements deemed to be forward-looking statements, including statements that address results or developments that Aura expects or anticipates may occur in the future. Any such statements are not guarantees of any future performance and actual results or developments may differ materially from those projected in the forward-looking statements. This information is for the use of only those persons to whom it is given. If you are not the intended recipient, you must not disclose, redistribute or use the information in any way.
Aura Group subsidiaries issuing this information include Aura Group (Singapore) Pte Ltd (Registration No. 201537140R) which is regulated by the Monetary Authority of Singapore as a holder of a Capital Markets Services Licence, and Aura Capital Pty Ltd (ACN 143 700 887) Australian Financial Services Licence 366230 holder in Australia.
The 19 April 2024 halving has decreased the reward to 3.125 Bitcoins. Each halving event has historically been followed by significant bullish trends...