Rising Treasury yields, volatile oil, and shifting central bank policy, along with our views on major currency pairs and gold.

This outlook contains information correct as at 1500hr on 06 Oct 2026
Rising yields and the neutral rate
October saw two things cast a shadow over the world: the ongoing Middle East crisis, which is keeping oil prices high and volatile, and a sell-off in US Treasuries pushing long-term interest rates higher. The 10-year Treasury yield hit a 19-year high of 5.236%, and the 30-year yield reached its highest level since 2002 at 5.63%.
With 2% inflation, the generally accepted long-term neutral Fed funds rate ranges from 3.0% to 3.2%, and by some measures it should be nearer 4%. In August, US headline inflation was 3.4% year on year, which would put the neutral Fed funds rate at around 4.4% to 4.6%.
From 1980 to 2026, the average US 10-year Treasury yield has hovered around 5%, and the average US 30-year yield has been roughly 6% or more. Should we be overly concerned when US 10-year and 30-year Treasury yields break above 5%?
In 1980, nearly every economist and analyst called for the collapse of the USD and the US economy. Long-term investors should ask two questions: will the USD still exist in 30 years, and are they happy to lock in 5%+ yields over the next 10 to 30 years? If so, it is a good time to buy US long-term Treasuries.
Fed policy and the labour market
At its September meeting, the FOMC raised rates by 0.25%, to a range of 3.75% to 4.00%, reasserting its inflation credibility as stronger growth, a resilient labour market and sticky inflation supported further tightening. Markets now expect two more 0.25% rate hikes, one in December and another in Q1 2027.
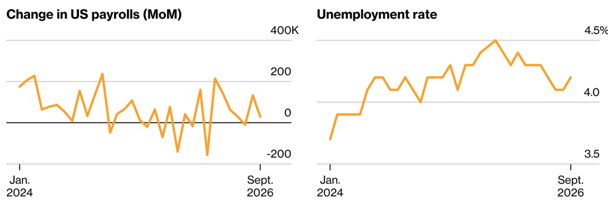
US September nonfarm payrolls were disappointing, rising by only 29,000 (Bloomberg consensus: 90,000). The unemployment rate rose to 4.2%.
Markets, oil and bond yields
September marked the close of a turbulent third quarter for stocks, which have hit successive highs this year. The S&P 500 fell 0.25% to 7,651, capping its worst monthly performance since June, while the Dow Jones Industrial Average dropped 0.86% to 50,906.05. The Nasdaq Composite bucked the trend, edging up 0.24% to 26,861.06, supported by resilience in AI-linked chipmakers.
Geopolitical risks from the ongoing Iran situation kept oil prices elevated, but as crude continues to flow through the Strait of Hormuz, the upside is capped. Before the war, the Middle East exported some 19 million barrels of crude oil every day. Kpler, a firm that tracks oil tankers, reported that volumes climbed back to an average of 16 million barrels in September, not far off pre-war levels. Some 6 million barrels a day are coming through land pipelines and ports on the Red Sea or the Gulf of Oman that bypass the Strait of Hormuz, while 10 million are making it through the Strait itself, as more tankers are now willing to take the risk of crossing due to higher fees and US military air protection. WTI went above USD 102 in September but is trading around USD 88.50 (1 September: USD 85.50).
Overnight, US 10-year Treasuries closed unchanged at 5.31% (1 September: 4.78%), Australian 10-year government bonds rose 0.06% to 5.40% (1 September: 5.17%), and Euro 10-year bonds rose 0.03% to 3.49% (1 September: 3.32%).
On 5 October, the USD index (DXY) tested a one-year high at 102.50. The USD remains resilient on expectations of higher US interest rates.
Sources: Bloomberg, MSNBC, Reuters, Morningstar, Business Times, 06 Oct 2026
Currency Focus
AUDUSD
Last week, the RBA, as expected, hiked the official cash rate by 0.25% to 4.60%, a 15-year high. The decision was unanimous, and the Board said the cash rate might rise further if needed. This fourth rate increase this year was followed by the release of August CPI, which showed headline inflation rising to 4.0%, above the RBA’s 2% to 3% target band.
The move provided no support for the AUDUSD, as the sell-off continues. The thinking behind this is that as long as China’s economy remains moribund and its purchases of Australian products are reduced, demand for the AUD will be weak. Furthermore, the interest rate gap between the AUD and USD has almost closed, from about 0.85% in the AUD’s favour a few months ago.
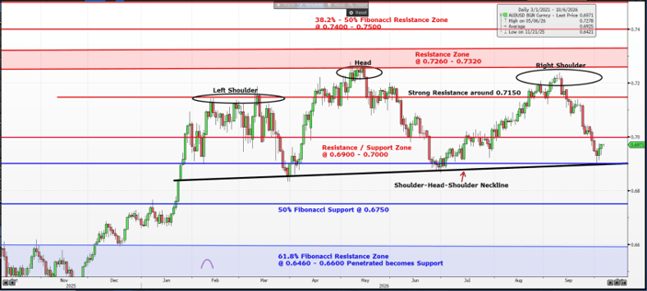
As we expected, the AUDUSD’s three-month rally ended before the 0.7260 to 0.7320 resistance zone. However, the sharp fall into the support/resistance zone at 0.6900 to 0.7000 was surprising. A bearish head and shoulders pattern has formed on the chart, with the neckline around 0.6900. There is a strong chance the AUDUSD breaks below the neckline and heads towards the technical objective at the 61.8% Fibonacci support zone of 0.6460 to 0.6600.
Image Source: Bloomberg 06 Oct 2026
EURUSD
September Eurozone headline inflation rose sharply to 3.8% year on year (August: 3.2%), driven mainly by a renewed surge in energy prices. The upside surprise in both headline and core inflation, measured as quarterly averages, remains broadly consistent with the ECB’s latest projections. This appears to limit the ECB’s medium-term interest rate outlook and any strength in the EURUSD.
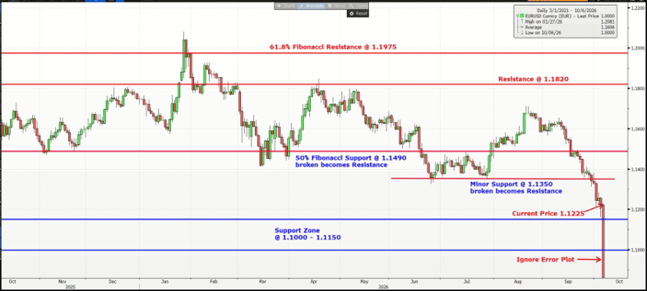
The EURUSD’s steep drop in September was greater than expected, falling below our target of 1.1490 and towards 1.1200. We expect a period of consolidation before a push towards the support zone at 1.1000 to 1.1150.
Image Source: Bloomberg 06 Oct 2026
GBPUSD
At its mid-September meeting, the BoE kept the Bank Rate unchanged at 3.75%, with the MPC voting 6 to 3 to hold. It expects CPI inflation to rise to around 3.75% in Q4 and above 4.00% in Q1 2027. However, persistent inflation driven by higher oil and gas prices may force the Bank to opt for a precautionary rate hike before year-end.
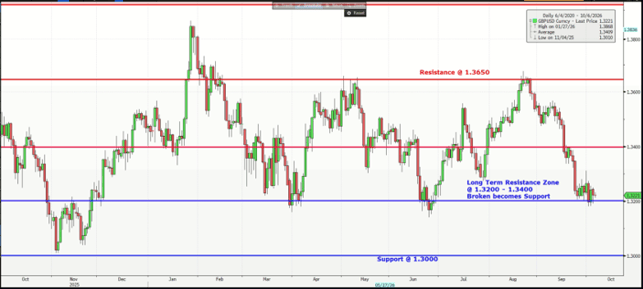
Our view that GBPUSD would move lower for a test of the 1.3200 to 1.3400 support zone was correct. Year to date, GBPUSD has formed three large multiple tops. We are likely to see GBPUSD break through the lower end of the support zone at 1.3200 and head towards the next support at 1.3000.
Image Source: Bloomberg 06 Oct 2026
USDJPY
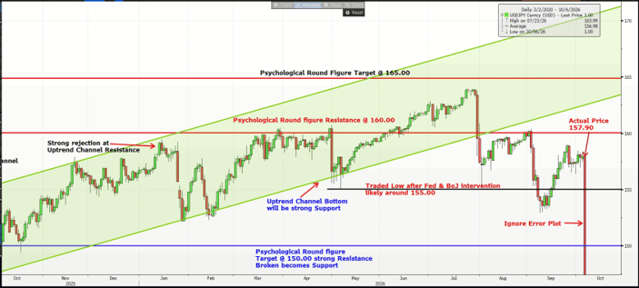
On 18 September, the BoJ raised interest rates by 0.25% to 1.25%, the highest level in 31 years. The BoJ is expected to raise rates by a further 0.25% into 2027, bringing its policy rate to 1.5% by Q3 2027. However, repeated FX interventions, timid rate increases and the lack of explicit hawkish guidance have left the JPY vulnerable.
USDJPY was again repelled at the 160.00 level but has since rebounded strongly. We expect USDJPY to be trapped between 154.00 and 160.00 as FX markets continue to probe the upside.
Image Source: Bloomberg 06 Oct 2026
USDSGD
The Monetary Authority of Singapore will release its October Monetary Policy Statement on 14 October. The base case is that it will maintain its current S$NEER (Singapore dollar nominal effective exchange rate) policy settings, with the slope remaining at an estimated 1.25% per annum, following two tightening moves in April and July this year. This should keep the SGD on a stable to strengthening trend.
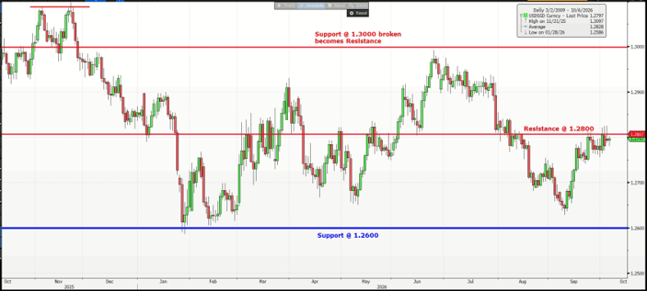
In line with our view, USDSGD moved lower in September to near support at 1.2600 but has since bounced to test resistance at 1.2800. We maintain our stance that USDSGD will move lower again to test and likely break below the 1.2600 support.
Image Source: Bloomberg 06 Oct 2026
AUDSGD
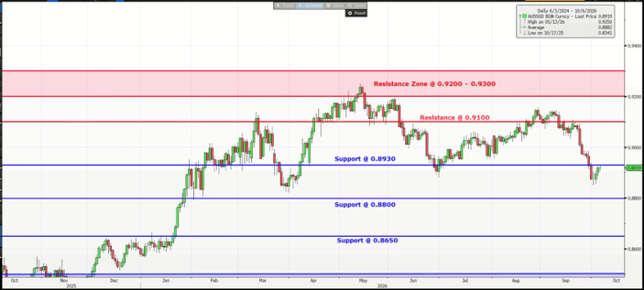
As expected, AUDSGD was unable to hold above resistance at 0.9100 and has turned down sharply. AUDSGD is likely to move lower to test and possibly break the 0.8800 support in the coming weeks.
Image Source: Bloomberg 06 Oct 2026
XAUUSD
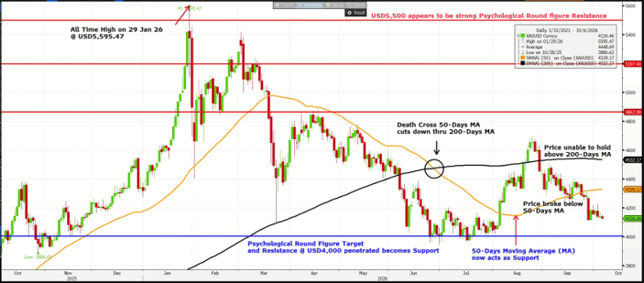
Central banks have bought gold over the last few years. As at Q1 2024, in USD terms, gold had surpassed the euro and now ranks second as a global reserve currency. After hitting a record high of USD 5,595.47 on 29 January, the chart clearly shows gold in a downtrend for the rest of 2026. The continuing news of central bank and investor buying does not match the empirical evidence.
The death cross is still in play, as gold has fallen back below its 50-day moving average. Technicals indicate a severe test of USD 4,000 support, which is likely to break. XAUUSD will probably end 2027 at its lows.
Image Source: Bloomberg 06 Oct 2026
Note: In the Candlesticks Chart, Green bars mean the Close is higher than the Open price, and Brown bars mean the Close is lower than the Open price